About CAEP Annual Reporting
As part of CAEP accreditation requirements, UNC-Chapel Hill shares data demonstrating the effectiveness of its completers’ instruction on P-12 student learning and development, and completer and employer satisfaction with the relevance and effectiveness of preparation.
Measure 1: Impact on P-12 Learning and Development
Measure 1: Indicators of Teaching Effectiveness
Measure 2: Satisfaction of Employers – Initial Programs
Measure 2: Satisfaction of Employers—Advanced Programs
Measure 3: Candidate Competency at Completion—Initial Programs
Measure 3: Candidate Competency at Completion—Advanced Programs
Measure 4: Ability of Completers to be Hired
Measure 1: Impact on P-12 Learning and Development
These student growth data are in alignment with CAEP Annual Report Measure 1 (Initial): Completer effectiveness. (R4.1) and demonstrate completer impact in contributing to P-12 student-learning growth.
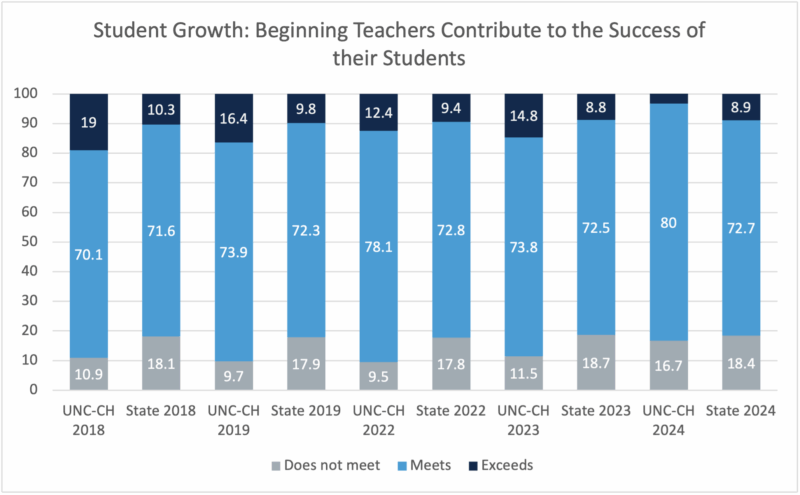
This graph shows P-12 student growth collected annually through North Carolina Educator Value-Added Assessment System (EVAAS) for beginning teachers (3 or less years of teaching) prepared by UNC-CH. The bars show the percentage of UNC-CH beginning teachers who do not meet, meet, or exceed expected growth for and all beginning teachers in North Carolina public schools.
EVAAS data from 2018 to 2024 are relatively consistent for UNC-CH. NCDPI did not collect P-12 student assessment data for 2019-20. In 2023, EVAAS data showed that 88% of UNC-CH prepared beginning teachers met or exceed growth expectations compared to the state’s 81%, whereas in 2024, 93% of UNC-CH prepared teachers met or exceeded expectations compared to the state’s 82%. This data was obtained from NC’s Department of Public Instruction Restricted EPP dashboard, where state-approved EPP student growth data is aggregated and maintained, including individual EPP data, as well as overall State data. A detailed description of how EPP student data is collated is provided here. The distribution of ratings is different compared to previous years (the distribution of those that exceed expectations is decreasing across the state, while those meeting expectations is increasing).
UNC-CH monitors EVAAS data annually, seeking opportunities to make targeted improvements in program areas and their coursework. We also monitor these data as they are a key component in the new accountability model for North Carolina EPPs. These data suggest opportunities for program improvement post-COVID. Of note, we are eager to ascertain the if performance trends for UNC-CH and the state data return to pre-pandemic rates—where UNC-CH has higher rates of teachers meeting or exceeding student growth estimates than the state average — or if the trend will shift.
Data was not collected in 2020 and 2021 due to COVID-19.
Data Source: NCDPI EPP Performance Report
Measure 1: Indicators of Teaching Effectiveness
These teacher effectiveness data align with CAEP Annual Report Measure 1 (Initial): Completer effectiveness. (R4.1) and demonstrate completer effectiveness in applying professional knowledge, skills, and dispositions.
Data Source: NCDPI EPP Performance Report
Student assessment data was not collected for Spring 2020 due to COVID-19.
Data Source: NCDPI EPP Performance Report
Student assessment data was not collected for Spring 2020 due to COVID-19.
Data Source: NCDPI EPP Performance Report
Student assessment data was not collected for Spring 2020 due to COVID-19.
Data Source: NCDPI EPP Performance Report
Student assessment data was not collected for Spring 2020 due to COVID-19.
Data Source: NCDPI EPP Performance Report
Student assessment data was not collected for Spring 2020 due to COVID-19.
Data Source: NCDPI EPP Performance Report
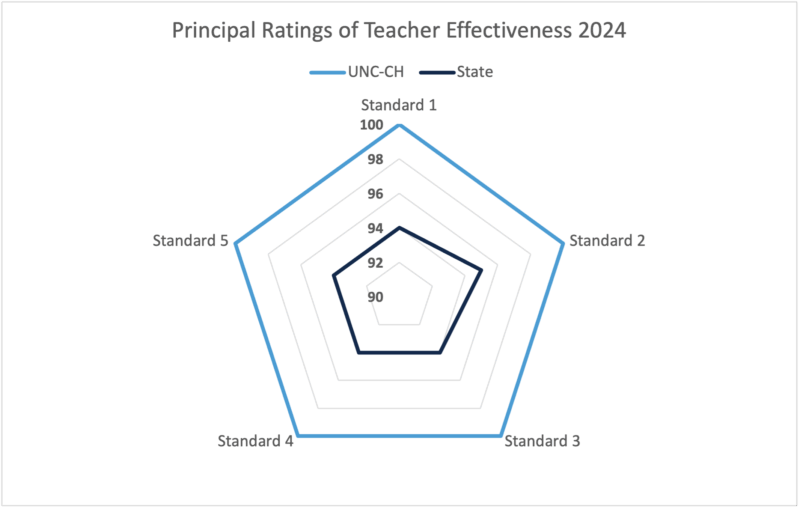
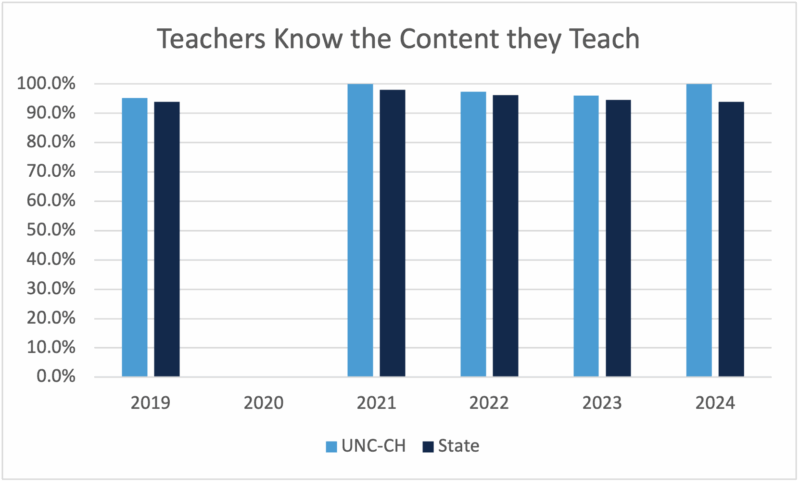
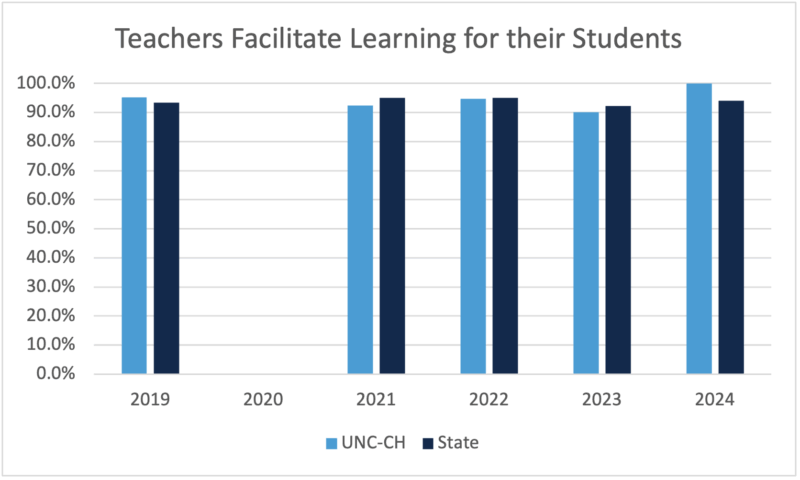
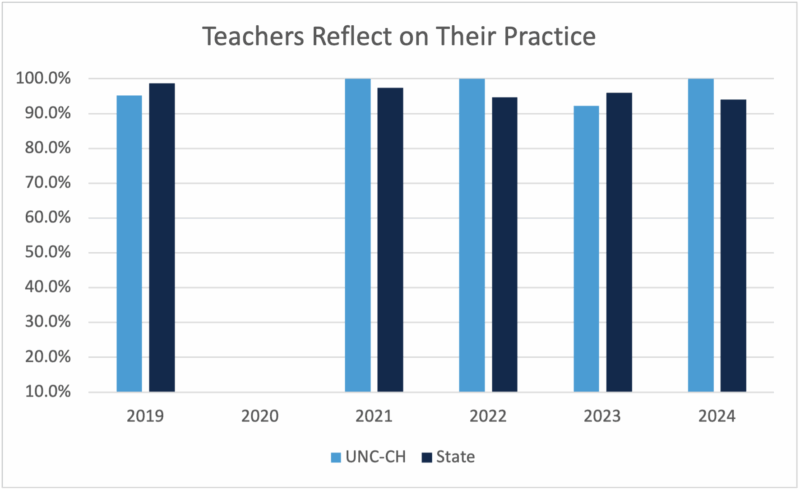
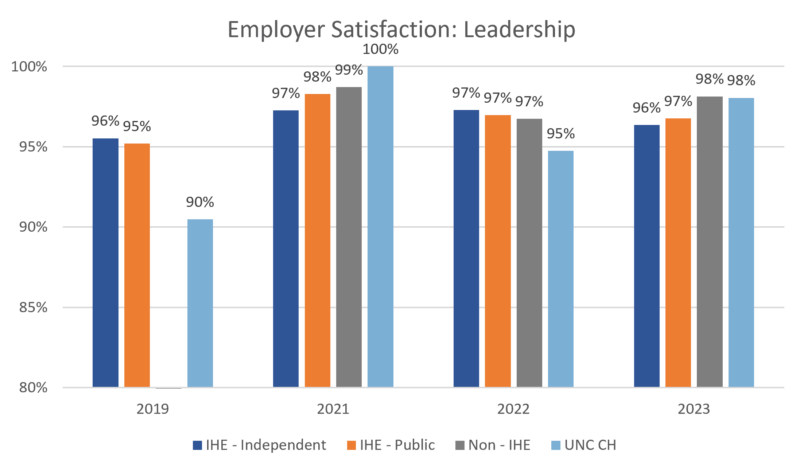
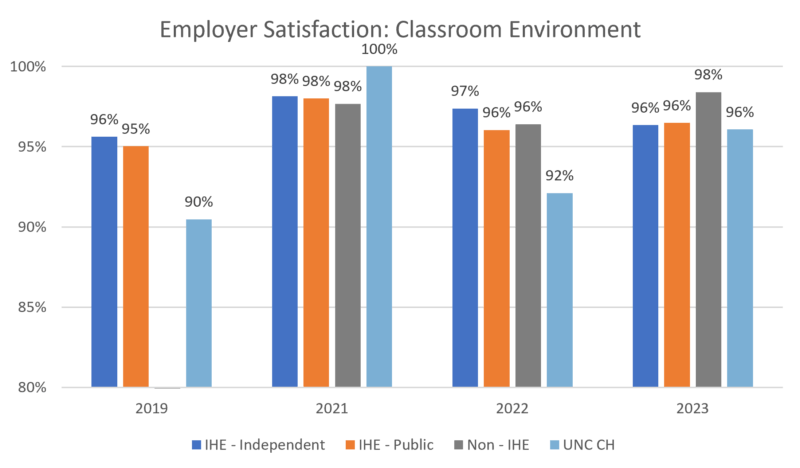
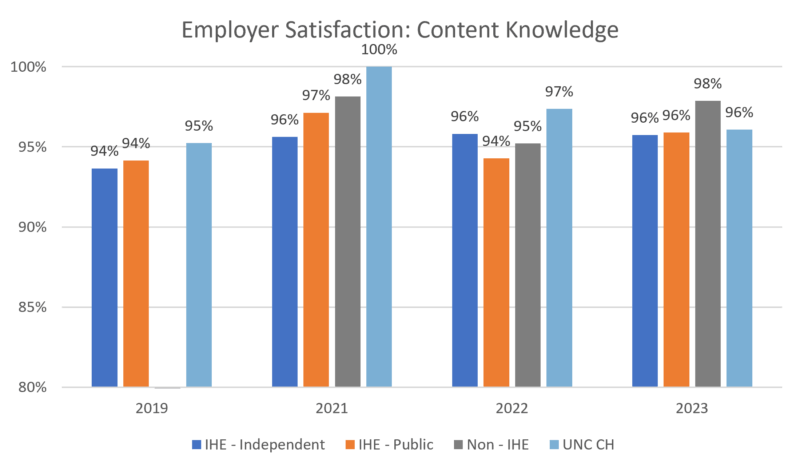
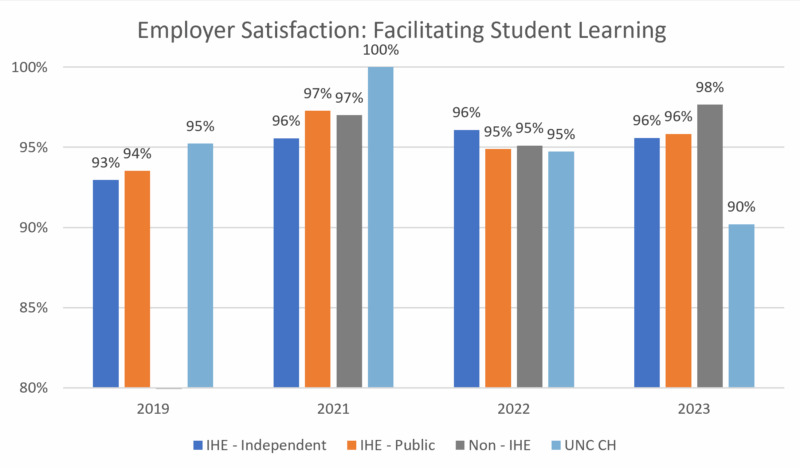
This set of data/graphs shows school administrators’ ratings of UNC-CH prepared beginning teachers (3 or less years of teaching) on the NCEES criteria (North Carolina Educator Evaluation Systems):
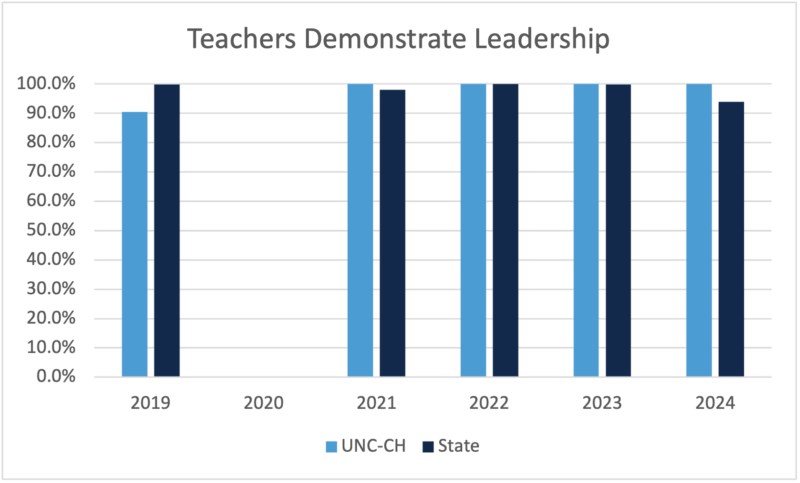
- Standard 1: Teachers Demonstrate Leadership
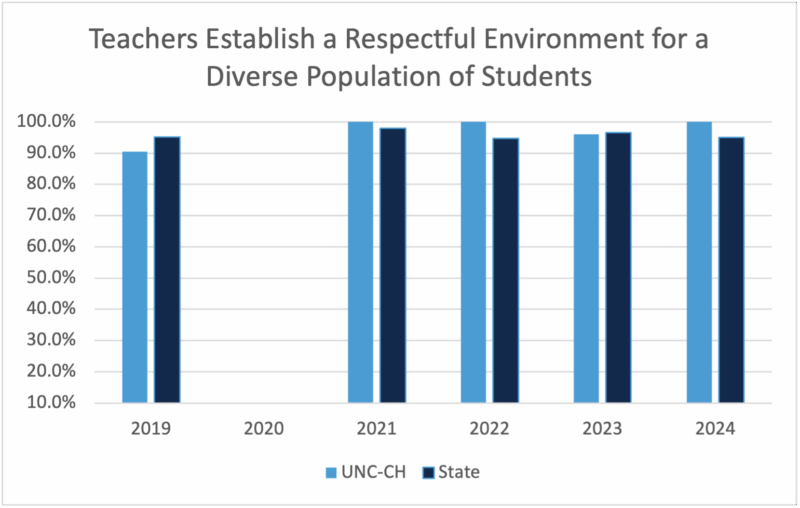
- Standard 2: Teachers Establish a Respectful Environment for a Diverse Population of Students
- Standard 3: Teachers Know the Content They Teach
- Standard 4: Teachers Facilitate Learning for Their Students
- Standard 5: Teachers Reflect on Their Practice
NCDPI collects teacher effectiveness data on beginning teachers each year except for Covid-impacted 2019-20. School Administrators rate the level at which Beginning teachers meet Standards 1-5 as they move from ratings of ‘Developing’ to ‘Distinguished’. Effective 2020-21, at the end of their third year beginning teachers must be rated ‘Proficient’ on Standards 1-5 on the most recent ‘Teacher Summary Rating Form’ to be eligible for the Standard Professional 2 license. New teachers are more likely to be rated lower on the evaluation standards, as they are still learning and developing new skills and knowledge.
Evaluation results from 2019 through 2024 indicate that UNC-CH prepared beginning teachers consistently received high ratings on all NCEES criteria. Specifically, during these years, 90% of all UNC-CH beginning teachers were rated proficient, accomplished, or distinguished on all NCEES criteria, which for most standards has been consistently higher than statewide ratings. In 2024, 96% of UNC-CH beginning teachers were rated at proficient or above, higher than the state average, on all NCEES criteria.
The program uses these data as an important marker of principal/employer feedback on our completers. In our continuous program improvement conversations, we triangulate these data with those from the NC Employer survey to generate a more holistic view of how graduates are perceived by their supervising administrators during their first years of teaching.
Data Source: NCDPI EPP Report Cards
Measure 2: Satisfaction of Employers – Initial Programs
NC School Employer survey data are in alignment with CAEP Annual Report Measure 2 (Initial): Satisfaction of employer and stakeholder involvement. (R4.2|R5.3)
Data source: NCDPI Educator Preparation Program Dashboard
Data Source: NCDPI – NC Employer Survey
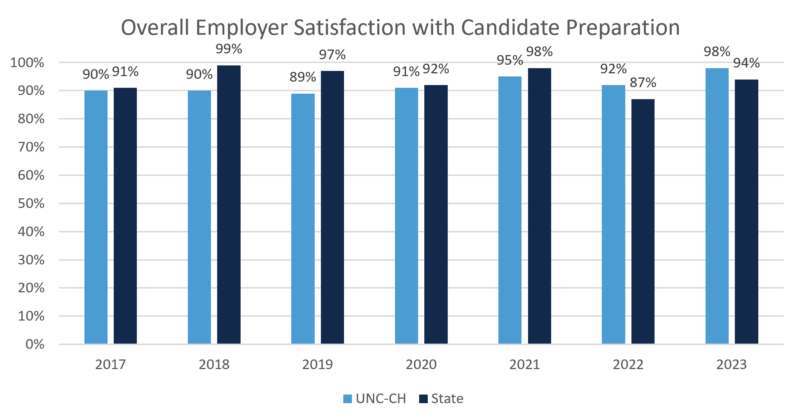
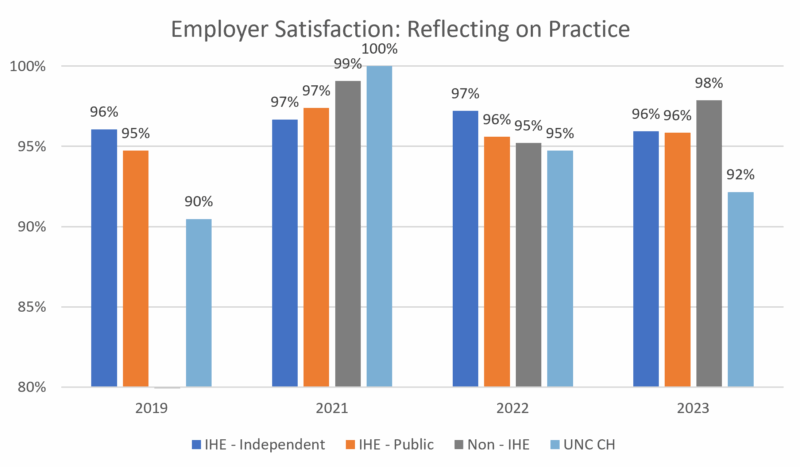
First administered in 2016-17 by NCDPI and the Education Policy Initiative at Carolina (EPIC), the NC School Employer survey asks school principals or assistant principals to rate the effectiveness of first-year teachers on 29 teaching tasks that are aligned with the state’s professional teaching standards, comparing to other NC prepared, out-of-state, and alternative entry first-year teachers. The first-year teachers are rated on a scale of 1 to 5: Much Less Effective, Less Effective, Comparable, More Effective, and Much More Effective.
This set of graphs shows principals’ overall satisfaction with UNC-CH first year teachers, through the percentage of principals’ that are rates as proficient or above for each of the five professional standards compared to other EPP groups.
UNC-CH first-year teachers are rated against other groups of educator preparation programs (EPPs), such as other public or private EPPs, or non-higher education EPPs, on all NC professional teaching standards over years. The 2024 radar graph demonstrates that UNC-CH graduates received higher ratings than other teacher preparation programs on all five teaching standards.
The program uses these data as an important marker of principal/employer feedback on our completers. We triangulate these data with those from the NC Principal evaluations to generate a more holistic view of how graduates are perceived by their supervising administrators during their first years of teaching. We see some points of alignment between the data sources and some areas for further investigation. As noted previously, one area for further analysis and action is related to Standard 3: Teachers know the content they teach. Principal ratings and the Employer survey differ in their ratings. The Employer Survey rates UNC completers lowest on Standard 3, yet still higher than other non-UNC prepared teachers. UNC-CH is examining different ways to address and assess content knowledge development in our program and how it is demonstrated in the field.
Measure 2: Satisfaction of Employers—Advanced Programs
These data are aligned with CAEP Annual Report Measure 2 (Advanced): Satisfaction of employer and stakeholder involvement. (RA4.1 and RA5.3)
To support EPPs’ continuous improvement efforts and accreditation needs, NCDPI started providing employment data for EPP completers in 2018 and set to release this data annually in April. NCDPI employment data identifies all UNC SOE completers who have graduated with a degree and been employed as an educator in North Carolina public or charter schools. These data include completers’ identifications, employee information, completers’ job title, and the degree levels earned at UNC.
While UNC School of Education is using proxy measures to address Employer Satisfaction with our advanced candidates, the unit is actively working to develop and implement stronger feedback mechanisms for its graduates.
Highest Employing N.C. Public School Units of UNC Completers 2023-24
| North Carolina PSUs | UNC School of Education Alumni Job Placements |
| Wake County Schools | 234 |
| Durham Public Schools | 124 |
| Chapel Hill-Carrboro City Schools | 99 |
| Charlotte-Mecklenburg Schools | 41 |
| Chatham County Schools | 34 |
| Orange County Schools | 33 |
| Winston-Salem / Forsyth County Schools | 19 |
| Guilford County Schools | 18 |
| Alamance-Burlington Schools | 17 |
| Johnston County Public Schools | 10 |
Data Source: NCDPI Restricted-use EPP Dashboard 2023-24
Measure 3: Candidate Competency at Completion—Initial Programs
This set of assessments align with CAEP Annual Report Measure 3 (Initial): candidate competency at completion. (R3.3) and shows UNC-CH candidates are meeting program expectations and ready to be recommended for licensure.
Data obtained from NCDPI EPP License Exam Dashboard: Workbook: EPP License Exam Pass Rates
Data Source: Title II Reports
Data sources: NC DPI Educator Preparation Program Dashboard and EdReports – EdReports – Sign In (nesinc.com)
At program completion, UNC-CH initial teacher candidates are evaluated on multiple performance metrics which include NC Licensure Exams, edTPA, NC LEA/IHE Certification of Teaching Capacity and Course Grades to determine qualification for program completion and licensure recommendation.
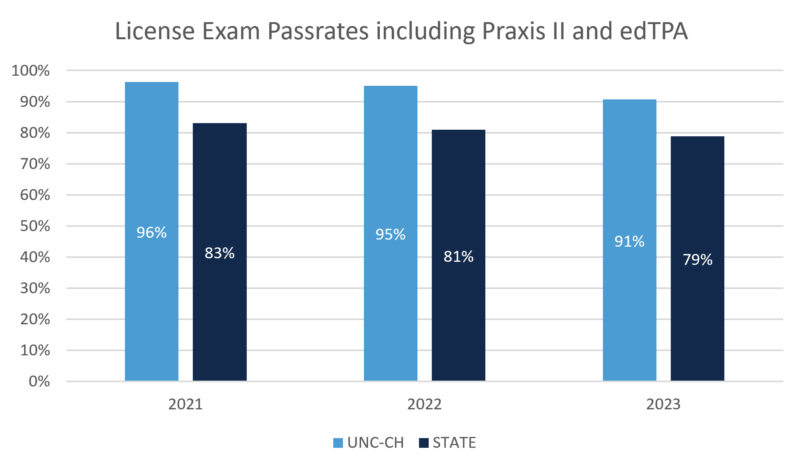
The Federal Title II program collects Licensure assessment data including Praxis II and edTPA for all licensure areas, and Foundations of Reading for Elementary Education, and then calculates pass rates annually to demonstrate EPP quality. The UNC-CH pass rate has been consistently 95% or above and significantly higher than North Carolina statewide average. In 2023-24, the overall Licensure pass rate was 100% – an increase from prior years – and higher than the state pass rate of 69%.
NCDPI monitors licensure exam pass rates for all NC Educator Preparation Programs through the NC Educator Preparation Program Dashboard. UNC-CH pass rates are generally 18-20% higher than other NC EPPs as a whole or by licensure areas.
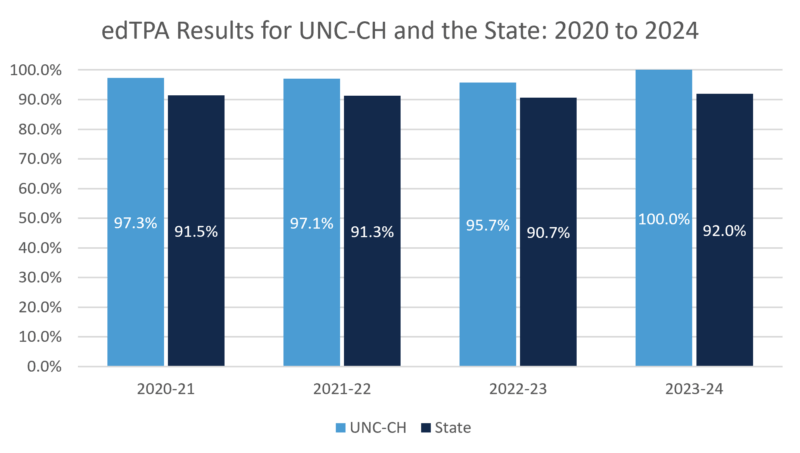
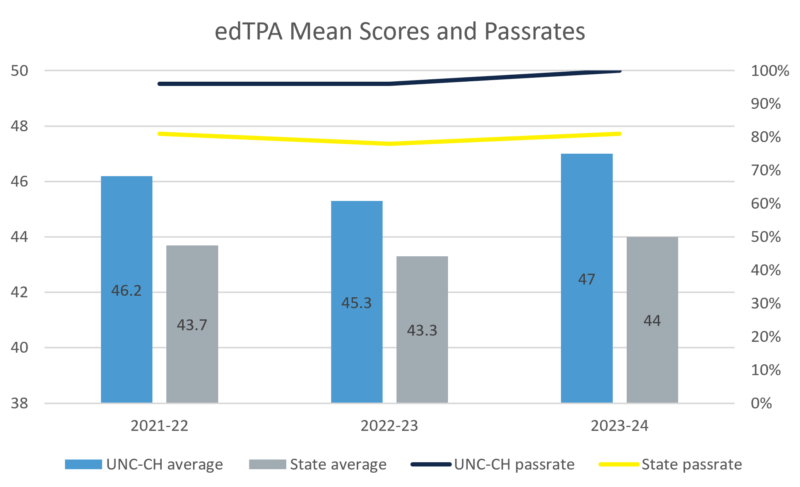
For the past three years, UNC-CH candidates received an average edTPA score of 45 or above, which is 8 points above the passing score and within this same domain, UNC-CH candidates’ edTPA scores were higher than candidates from North Carolina statewide and the national average. In addition, pass rates are generally 20% higher than other NC EPPs.
Measure 3: Candidate Competency at Completion—Advanced Programs
This set of assessments align with CAEP Annual Report Measure 3 (Advanced): candidate competency at completion. (RA3.4), and shows candidates are meeting program expectations and ready to be recommended for licensure.
At present, North Carolina does not require licensure exams for advanced licensure areas, UNC-CH advanced programs (MEdX-ECIFS, MSA and EdD Education Leadership) evaluate students’ competency through course embedded assessments (ESAs) and collects ESA data and other program artifacts in our e-Portfolio platform, Taskstream. All ESA rubrics are aligned with corresponding national standards.
The preliminary ESA data shows that UNC-CH are scored at 90 or higher on most national standards, with a variation from 85 to 100 among standards. These data provide evidence of candidate competency and an opportunity to identify area/standards for improvement.
Each of the advanced programs has an annual program review cycle during which its program data is reviewed and analyzed to inform program improvement activities. The data generated by the ESA forms a critical evidence base for this work and is examined holistically with other quality assurance measures, such as exit surveys and employment data.
EdD Ed Leadership: NELP District Level Standards Assessed in EdD Coursework (2023-24)
| NELP District Level Standards | Average Score (Scale to 100) |
| Standard 1: Mission, Vision and Improvement | 90 |
| Standard 2: Ethics and Professional Norms | 91.2 |
| Standard 3: Equity, Inclusiveness, and Cultural Responsiveness | 92.6 |
| Standard 4: Learning and Instruction | 85 |
| Standard 5: Community and External Leadership | 90 |
| Standard 6: Operation and Management | 90 |
| Standard 7: Policy, Governance, and Advocacy | 85 |
MEdX
All data presented in this section align to Early Intervention/Early Childhood Special Education (EI/ECSE) standards. At present MEDX-ECIFS Embedded Signature Assessments (ESAs) assess all of the seven EI/ECSE standards; ESA data are presented in data tables below.
| MEdX-ECIFS: Early Intervention/Early Childhood Special Education (EI/ECSE) standards Assessed in ECIFS Coursework (2024) | |
| EI/ECSE standards | Average Score (Scale to 100) |
| Standard 1: Child Development and Early Learning | 96.1 |
| Standard 2: Partnering with Families | 97.0 |
| Standard 3: Collaboration and Teaming | 94.1 |
| Standard 4: Assessment Processes | 87.5 |
| Standard 5: Applications of Curriculum Frameworks in the Planning and Facilitation of Meaningful Learning Experiences | 88.5 |
| Standard 6: Using Responsive and Reciprocal Interactions, Interventions, and Instruction | 97.2 |
| Standard 7: Professionalism and Ethical Practice | 92.6 |
MSA: NELP Building Level Standards Assessed in MSA Coursework (2022-23)
| MSA: NELP Building Level Standards Assessed in MSA Coursework (2024) | |
| NELP Building Level Standards | Average Score (Scale to 100) |
| Standard 1: Mission, Vision and Improvement | 93.2 |
| Standard 3: Equity, Inclusiveness, and Cultural Responsiveness | 76.9 |
| Standard 4: Learning and Instruction | 87.3 |
| Standard 5: Community and External Leadership | 93.1 |
| Standard 6: Operation and Management | 100 |
| Standard 7: Building Professional Capacity | 92.5 |
Data Source: Course-embedded assessment data collected in Taskstream
Measure 4: Ability of Completers to be Hired
This set of data aligns with CAEP Annual Report Measure 4 (Initial and Advanced): Ability of completers to be hired in positions for which they have prepared.
The ability of initially licensed teachers to be hired is best reported through the licensure and employment data from NCDPI EPP Performance Dashboard – Initial Employment and Retention .
The ability of advanced program completers to be hired into positions aligned with their programs of study utilizes employment data from NCDPI. For advanced completers we track employment in NC public schools and, more specifically, employment in certain job roles. The exception are graduates from UNC-CH’s MEDX ECIFS program. Many candidates return to the agency or private settings upon graduation and, therefore, are not present in NCDPI employment data.
The employment table shows that 65% of 2023-24 program graduates employed by North Carolina Public Schools in their prepared licensure areas one year after program completion in 2025.
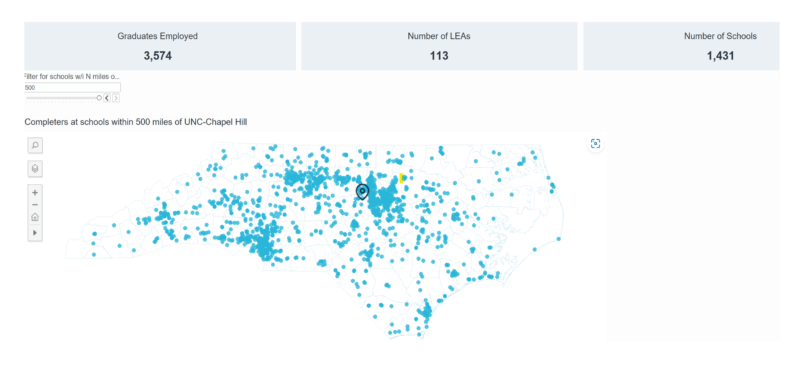
As demonstrated by the employment distribution maps, UNC-CH graduates serve various educator roles in 113 North Carolina districts with a concentration in Wake, Durham, Orange and Chatham school districts.
Each of the advanced programs has an annual program review cycle during which its program data is reviewed and analyzed to inform program improvement activities. The employment data provide a critical evidence base for this work and are examined holistically with other quality assurance measures, such as exit surveys and ESAs. We are also monitoring how our candidates move into positions outside of NC Public Schools, such as agency, institutional, or higher education settings, and move to other states. Our unit is developing these data sources to complement NCDPI data to provide a richer and more accurate reflection of completer employment.
Graduates employed by NC Public Schools in Prepared Licensure Areas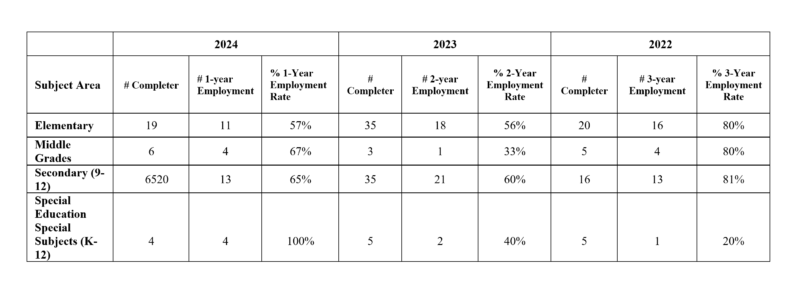
Data sources: NCDPI Employment Data from the restricted-use dashboard.
Data Source: NCDPI Employment Data from the restricted-use dashboard.
Note: This map includes UNC graduates who serve in teaching, student service or administrative roles in an NC Public School as of April 2025. The data may include BA, MAT, MEDX, MSA, School Counseling and other degree completers.
Disclaimer: We are currently updating the CAEP Accountability Measures data displayed on this page. The most current figures will be available by July 31, 2026. Please check back then for the latest information.